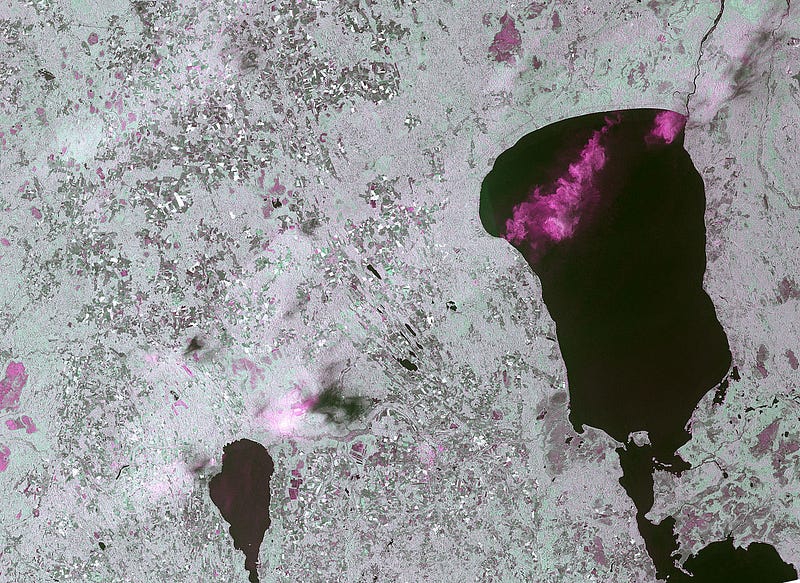
The image above depicts the thunderstorms over Estonia in false color RGB with VV-, VH- and VV+, VH- polarization backscatter. I also had no clue what that meant.
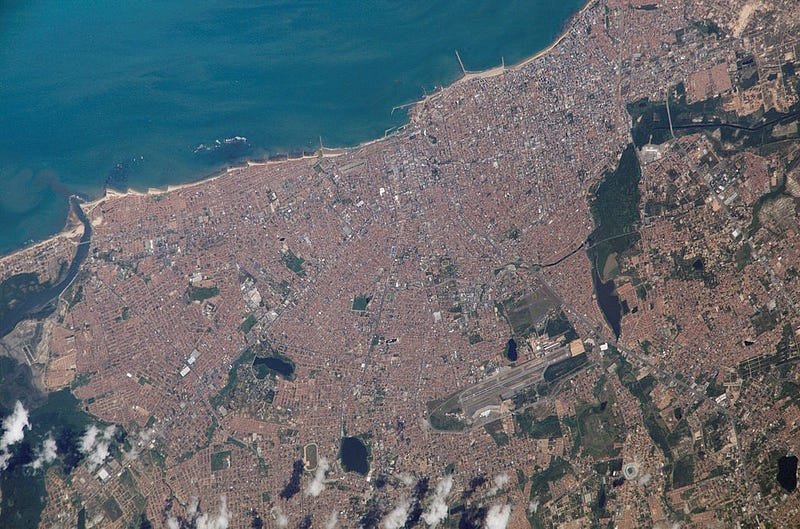
When talking about remote sensing images, one may assume a photo with colors of the objects visible to a human eye, such as below:
However, satellites are capable of capturing space in a wide range of waves in the electromagnetic spectrum. Not only do multispectral images with extra band information (e.g. Near Infrared) exist to extract useful values for analyzing images (e.g. NDVI), but so do Radio Detection And Ranging (RADAR) systems which use radio waves to determine the distance, angle, velocity of objects. Synthetic Aperture Radar (SAR) is one of those systems.
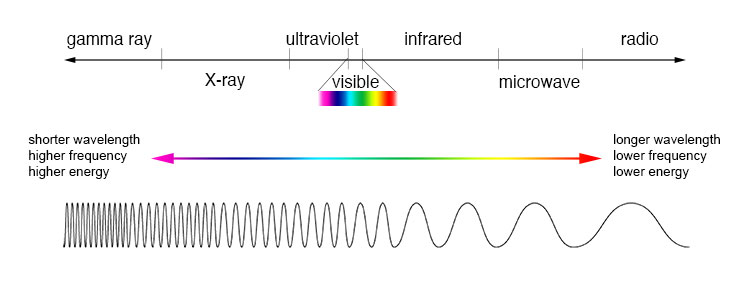
Table of Contents
- Why Synthetic Aperture Radars?
- Real vs Synthetic Aperture Radars
- Synthetic Aperture Radar Bands
- What is Polarization?
- Polarization in Synthetic Aperture Radars
- Scattering of SAR Signals
- Shadowing, Foreshortening, and Layover in SAR
- Pixel Brightness of SAR
- Sensor Parameters of SAR
- Surface Parameters of SAR
- Interferometric Synthetic Aperture Radar (InSAR)
- Synthetic Aperture Radar Datasets
- Synthetic Aperture Radars in Space Archeology
- References and Further Readings
Why Synthetic Aperture Radars?
It turns out, even images produced by the best optical remote sensing cameras are not that useful at night, or when clouds or smoke are present. Here, Synthetic Aperture Radars come in handy, which, instead of utilizing the light from the sun, produce their own energy with the help of sensors, and record the amount of reflected energy that interacts with the Earth.
Real vs Synthetic Aperture Radars
Real Aperture Radars (RAR) used for capturing images have one major disadvantage, that is, the spatial resolution (physical dimension representing each pixel) of an image is directly proportional to the length of the radar’s antenna. A satellite operating at a wavelength of 5 cm should be 47 football fields long (~4,250m) to get the spatial resolution of 10m (see the references below). Synthetic Aperture Radars’ task is to simulate RARs with smaller antenna while gaining data with a decent spatial resolution. Even if the concept is more complicated, the working principle of SAR is that its antenna is constantly in motion, changing location in time, which helps to duplicate the effect of several antennas of RAR.
Synthetic Aperture Radar Bands
SAR bands may have different wavelengths and frequency ranges; they determine the reflection and penetration characteristics of the signal. Bands starting with the letter ‘K’ are rarely used in SARs. Let’s briefly discuss the usages of more popular bands:
- X — urban monitoring, finding ice and snow, poor penetration into vegetation, fast coherence decay.
- C — global mapping and change detection, ice, ocean maritime navigation, low/moderate penetration.
- S —agriculture monitoring
- L — geophysical monitoring, biomass, and vegetation mapping, high penetration
- P — biomass, vegetation mapping and assessment, experimental SAR.

What is Polarization?
Before discussing further on SARs, we should refresh our memory on physics about the concept called polarization of the electromagnetic light waves. The first few minutes of the video below should be enough for understanding the topic of discussion.
So why know polarization? It turns out, SAR sensors usually transmit waves that are linearly polarized: H is denoted to describe horizontal polarization, whereas V indicates vertical polarization. For example, VH would mean for us vertical emission and horizontal receive of polarization. Different polarization and wavelength combinations can help us to get different information about the Earth’s surface.
Polarization in Synthetic Aperture Radars
Systems can be ‘single-pol’ (meaning, single-polarization — HH or VV), ‘dual-pol’ (transmitting in one polarization and receiving in two — HH, HV or VH, VV), and ‘quad-pol’ (alternating between transmitting horizontal and vertical waves, and receiving both of them — HH, HV, VH, VV). There is also a variant called ‘quasi-quad-pol’ which is meant to be an improvement over ‘quad-pol’. To learn further about different polarization aspects of SAR, you may refer to the NISAR article.
Circularly polarized transmission is used less often. The Khanacademy video above explains the concept well; radars achieve circular polarization by simultaneously transmitting phase-shifted horizontal and vertical signals. Transmitting a circularly polarized wave in a clockwise or counter-clockwise direction (right or left, R or L) and receiving H and V is called ‘compact-pol’. It improves over ‘dual-pol’ by differentiating oriented surfaces with a better load-balancing in receive channels.
Scattering of SAR Signals
Sensors have the ability to control polarization on both transmit and receive. Why do we need that? Well, examining signal strength in various polarizations may guide us to understand the structure of the Earth’s surface. Three cases of scattering are possible: rough surface, volume, double bounce.

- Rough surface (bare soil, water, etc) is most sensitive to VV scattering.
- Volume (leaves, canopy branches, etc) is most sensitive to VH or HV scattering.
- Double bounce (buildings, tree trunks, etc) is most sensitive to HH scattering.
The signal amount for the scattering types mentioned above may change due to the chosen wavelength, which affects the penetration level of the signal. C-band signal will penetrate poorly to the canopy of a forest and return rough surface scattering with a little volume scattering. Bands with lower frequency (longer wavelength) will experience volume scattering and double-bounce scattering (caused by the tree trunk) due to the deeper penetration of the signal.
Shadowing, Foreshortening, and Layover in SAR
There are several important concepts specific to SAR needs to be understood for analyzing the SAR data. Accepting the fact that the surface of the Earth is rarely flat, we should take into account the properties of uneven surfaces on how the radar sensors perceive the singals.
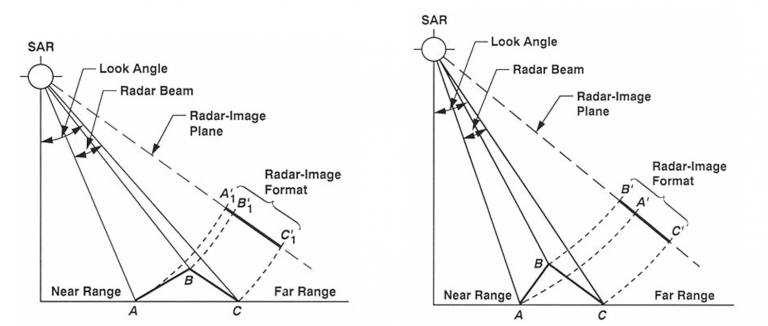
Shadowing. If in an optical image an object blocks the sunlight to create shadow, in SARs, the cause is the blockage of the radar beams. However, if in an optical image we can extract certain information and sometimes guess what is under the shadow, in SAR we have a dead-end: there is no return signal and hence no information about the area of the shadows.
Foreshortening. As can be seen in the left image above, the radar signal reaches the point B on the surface just shortly after reaching the point A. From here, the returned A-B slope is shorter than the actual physical distance between these two points on the surface, and as a result, some objects, such as mountains, appear to be steeper than they are. To decrease this effect we should use a larger look angle.
Layover. During an extreme foreshortening, for example in a very tall building, the SARs signal may even reach point B before A. As a result, objects in the image may seem as if they lie on a flat surface or even get flipped.
It is important to note that the look angle matters a lot while trying to understand these phenomena. Larger the look angle, lengthier are the shadows, and less is foreshortening and layover, and vice versa.
Pixel Brightness of SAR
Radar images are visually similar to monochrome optical images, however, the brightness of the pixels do not indicate the brightness of the color of the objects. Brightness depends on the transmitted SAR energy, the radar’s view angle, and material and shape of the object.
Sensor Parameters of SAR
While designing the SARs, engineers should tune several important parameters, such as wavelength and polarization in order to extract the maximum and most useful information about the target surface. Parameters, once chosen, cannot be changed after the launch of SARs.
- Wavelength has an impact on the azimuth resolution penetration of the waves onto the surface.
- Look angle, as discussed, has its effect on shadow, foreshortening, and layover, as well as pixel brightness.
- Polarization has its effect on the pixel brightness.
Surface Parameters of SAR
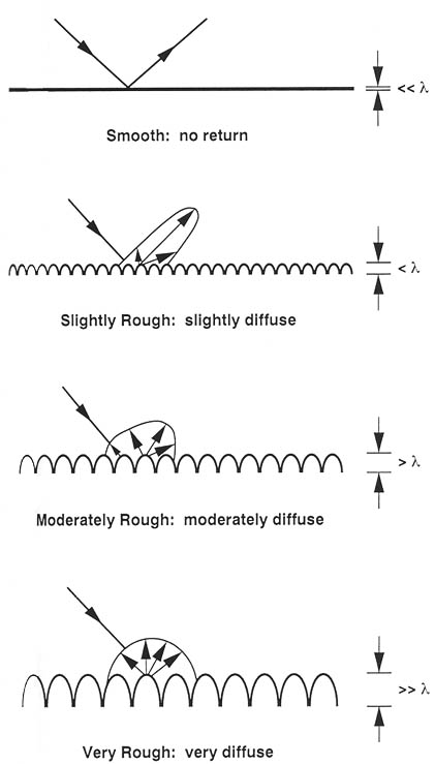
Two parameters affect the pixel brightness of the image: surface roughness (with respect to radar’s wavelength), and scattering material (dielectric constant of the object). Smoother the surface, specular is the reflectance (see the image below). A rough surface scatters the signal in all directions (diffuse scattering). The dielectric constant determines the reflectiveness of the material when interacting with electromagnetic waves.
Interferometric Synthetic Aperture Radar (InSAR)
The analysis called interferometry can be extracted from the available SAR data (InSAR). It measures the distance from the sensor to the surface based on the phase information. With InSAR, very precise land cover change calculations can be performed to explore deforestation, consequences of earthquakes or volcanic eruptions. For further information on InSAR, you may refer to the USGS article.
Synthetic Aperture Radar Datasets
With the launch and open data policy of the European Space Agency’s (ESA) Sentinel-1a in 2014, large SAR data has been available for the public. The list of other datasets can be found in the article of Earthdata, in the section called data availability. Earthdata Search itself has the largest free and publicly available dataset for SAR.
Low-level SAR data requires tedious pre-processing, such as ‘applying the orbit file, radiometric calibration, de-bursting, multilooking, speckle filtering, and terrain correction’. For more detail, you may refer to the SAR Pre-Processing one-pager. NASA’s Alaska Satellite Facility Distributed Active Archive Center (ASF DAAC) provides preprocessed data for radiometrically terrain-corrected products for select areas.
Synthetic Aperture Radars in Space Archeology
SAR data can help scientists and archaeologists to discover lost cities and infrastructures hidden under dense vegetation or desert sands. In order to learn more about the usage of SAR data in space archeology, you may refer to the following extremely engaging articles written by NASA Earth Observatory: Peering through the Sands of Time and Secrets beneath the Sand.
References and Further Readings
- SAR Handbook: Comprehensive Methodologies for Forest Monitoring and Biomass Estimation
- What is Synthetic Aperture Radar? (Earthdata)
- Get to Know SAR — NASA-ISRO SAR Mission: Polarimetry (NISAR)
- Get to Know SAR — NASA-ISRO SAR Mission: Interferometry (NISAR)
- SAR 101: An Introduction to Synthetic Aperture Radar — Capella Space
- Real vs. Synthetic Aperture Radar Operations
- Sentinel-1 - Missions - Sentinel Online - Sentinel Online